

“…all the fluctuations in the market and in all the various stocks should be studied as if they were the result of one man’s operations. Let us call him the Composite Man, who, in theory, sits behind the scenes and manipulates the stocks to your disadvantage if you do not understand the game as he plays it; and to your great profit if you do understand it.”
(The Richard D. Wyckoff Course in Stock Market Science and Technique, section 9, p. 1-2)
Wyckoff advised retail traders to try to play the market game as the Composite Man played it.
Based on his years of observations of the market activities of large operators, Wyckoff taught that:
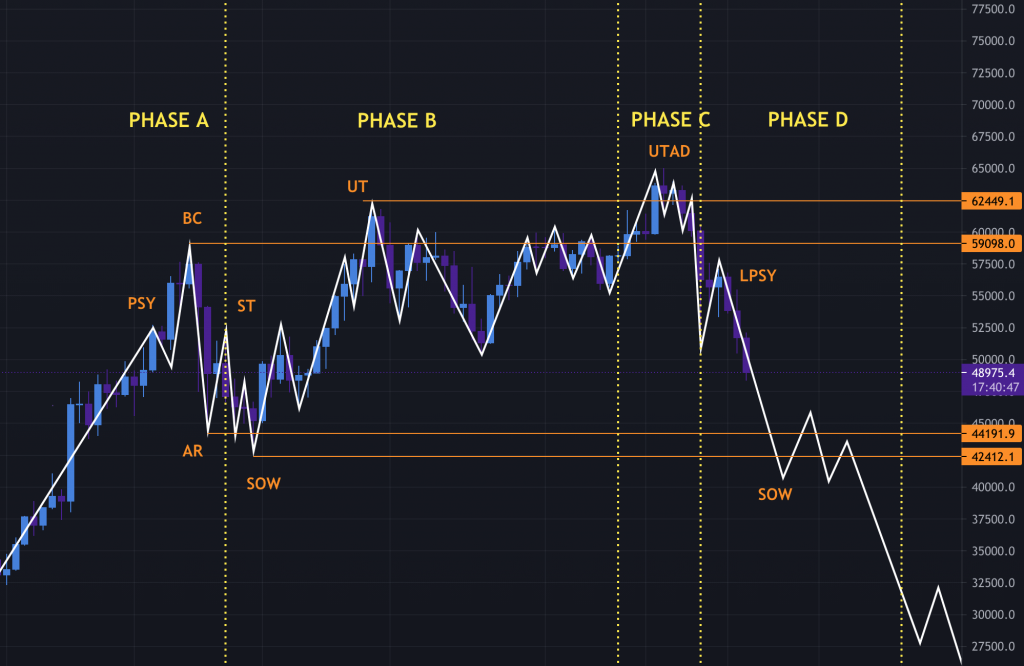
PSY – Preliminary Supply
where large interests begin to unload shares in quantity after a pronounced up-move. Volume expands and price spread widens, signaling that a change in trend may be approaching.
BC – Buying Climax
during which there are often marked increases in volume and price spread. The force of buying reaches a climax, with heavy or urgent buying by the public being filled by professional interests at prices near a top. A BC often coincides with a great earnings report or other good news, since the large operators require huge demand from the public to sell their shares without depressing the stock price.
AR – Automatic Reaction
with intense buying substantially diminished after the BC and heavy supply continuing, an AR takes place. The low of this selloff helps define the lower boundary of the distribution TR.
ST – Secondary Test
in which price revisits the area of the BC to test the demand/supply balance at these price levels. For a top to be confirmed, supply must outweigh demand; volume and spread should thus decrease as price approaches the resistance area of the BC. An ST may take the form of an upthrust (UT), in which price moves above the resistance represented by the BC and possibly other STs before quickly reversing to close below resistance. After a UT, price often tests the lower boundary of the TR.
SOW – Sign Of Weakness
observable as a down-move to (or slightly past) the lower boundary of the TR, usually occurring on increased spread and volume. The AR and the initial SOW(s) indicate a change of character in the price action of the stock: supply is now dominant.
LPSY – Last Point Of Supply
after testing support on a SOW, a feeble rally on narrow spread shows that the market is having considerable difficulty advancing. This inability to rally may be due to weak demand, substantial supply or both. LPSYs represent exhaustion of demand and the last waves of large operators’ distribution before markdown begins in earnest.
UTAD – Upthrust After Distribution
is the distributional counterpart to the spring and terminal shakeout in the accumulation TR. It occurs in the latter stages of the TR and provides a definitive test of new demand after a breakout above TR resistance. Analogous to springs and shakeouts, a UTAD is not a required structural element: the TR in Distribution Schematic #1 contains a UTAD, while the TR in Distribution Schematic #2 does not.
Phase A
Phase A in a distribution TR marks the stopping of the prior uptrend. Up to this point, demand has been dominant and the first significant evidence of supply entering the market is provided by preliminary supply (PSY) and the buying climax (BC). These events are usually followed by an automatic reaction (AR) and a secondary test (ST) of the BC, often upon diminished volume. However, the uptrend may also terminate without climactic action, instead demonstrating exhaustion of demand with decreasing spread and volume; less upward progress is made on each rally before significant supply emerges.
In a redistribution TR within a larger downtrend, Phase A may look more like the start of an accumulation TR (e.g., with climactic price and volume action to the downside). However, Phases B through E of a re-distribution TR can be analyzed in a similar manner to the distribution TR at the market top.
Phase B
The function of Phase B is to build a cause in preparation for a new downtrend. During this time, institutions and large professional interests are disposing of their long inventory and initiating short positions in anticipation of the next markdown. The points about Phase B in distribution are similar to those made for Phase B in accumulation, except that the large interests are net sellers of shares as the TR evolves, with the goal of exhausting as much of the remaining demand as possible. This process leaves clues that the supply/demand balance has tilted toward supply instead of demand. For instance, SOWs are usually accompanied by significantly increased spread and volume to the downside.
Phase C
In distribution, Phase C may reveal itself via an upthrust (UT) or UTAD. As noted above, a UT is the opposite of a spring. It is a price move above TR resistance that quickly reverses and closes in the TR. This is a test of the remaining demand. It is also a bull trap – it appears to signal the resumption of the uptrend but in reality is intended to “wrong-foot” uninformed break-out traders. A UT or UTAD allows large interests to mislead the public about the future trend direction and, subsequently, sell additional shares at elevated prices to such break-out traders and investors before the markdown begins. In addition, a UTAD may induce smaller traders in short positions to cover and surrender their shares to the larger interests who have engineered this move.
Aggressive traders may wish to initiate short positions after a UT or UTAD. The risk/reward ratio is often quite favorable. However, the “smart money” repeatedly stops out traders who initiate such short positions with one UT after another, so it is often safer to wait until Phase D and an LPSY.
Often demand is so weak in a distribution TR that price does not reach the level of the BC or initial ST. In this case, Phase C’s test of demand may be represented by a UT of a lower high within the TR.
Phase D
Phase D arrives after the tests in Phase C show us the last gasps of demand. During Phase D, price travels to or through TR support. The evidence that supply is clearly dominant increases either with a clear break of support or with a decline below the mid-point of the TR after a UT or UTAD. There are often multiple weak rallies within Phase D; these LPSYs represent excellent opportunities to initiate or add to profitable short positions. Anyone still in a long position during Phase D is asking for trouble.
Phase E
Phase E depicts the unfolding of the downtrend; the stock leaves the TR and supply is in control. Once TR support is broken on a major SOW, this breakdown is often tested with a rally that fails at or near support. This also represents a high-probability opportunity to sell short. Subsequent rallies during the markdown are usually feeble. Traders who have taken short positions can trail their stops as price declines. After a significant down-move, climactic action may signal the beginning of a re-distribution TR or of accumulation.
© 2024 Chart Fever. Built using WordPress and OnePage Express Theme.